See The Path
Broken viewMap how the work moves across staff, systems, reports, files, and dashboard views.
Dashboards should match the work. When the file says one thing, the workflow says another, and the owner is unclear, Spectre turns the mess into a clean operating view.
One tracker, report, dashboard, or handoff. Spectre maps the break and shows the first repair move.
Map how the work moves across staff, systems, reports, files, and dashboard views.
Find where the system record, staff action, owner, or dashboard output stops matching.
Leave teams with the issue, owner, test points, and a cleaner view.
The dashboard looks clean. The source file is already red. Faultline shows the split before the number becomes a decision.
The parser reads the workbook, tracker, report, or dashboard export. Spectre compares the source to the view, names the owner, and feeds the repair page.
Start with the file, tracker, report, or dashboard export that keeps costing time.
Compare the source record against the dashboard so a green view cannot hide a red file.
Leave the issue, owner, test points, next move, and clean view in one repair view.
Excel, SQL, Tableau, Power BI, and API sources feed one repair model: source state, dashboard state, owner path, and next action.
Start with the file costing time. Opsline cleans repeat work. Faultline shows the dashboard break. Hardline checks whether the repair holds.
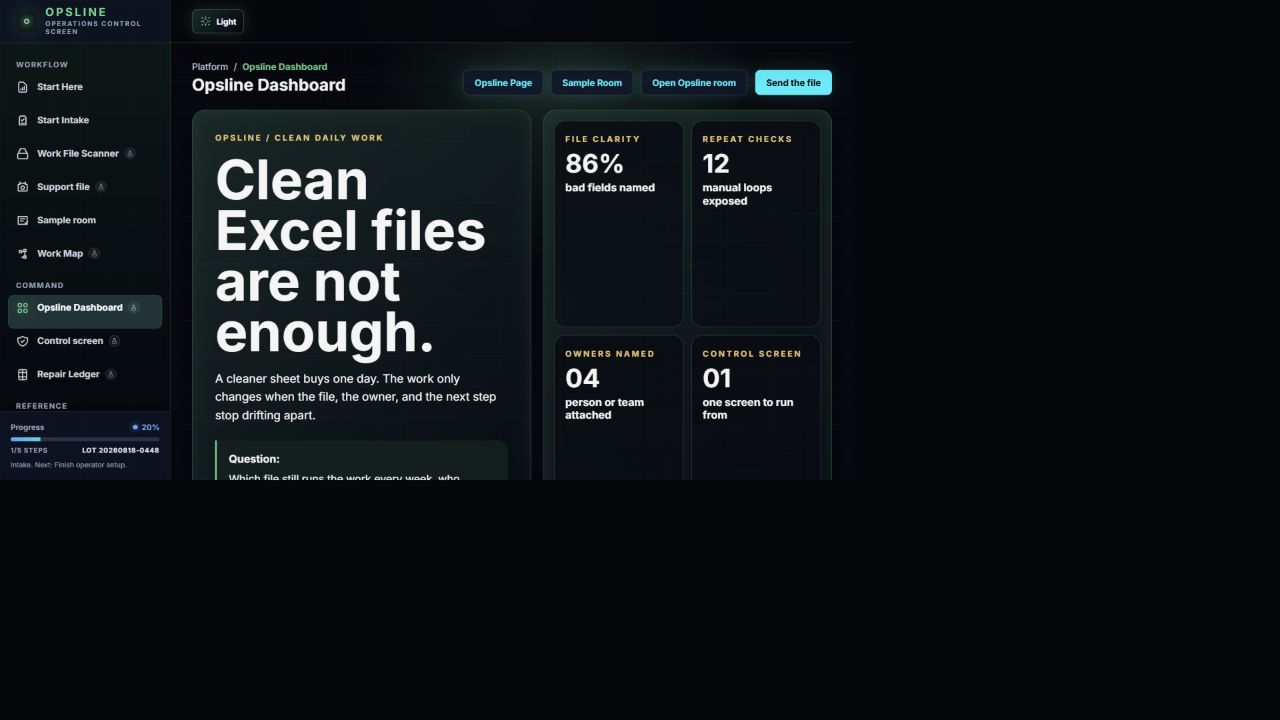
For sheets, trackers, intakes, and handoffs the team keeps fixing by hand.
File cleaned. Owner named. View ready.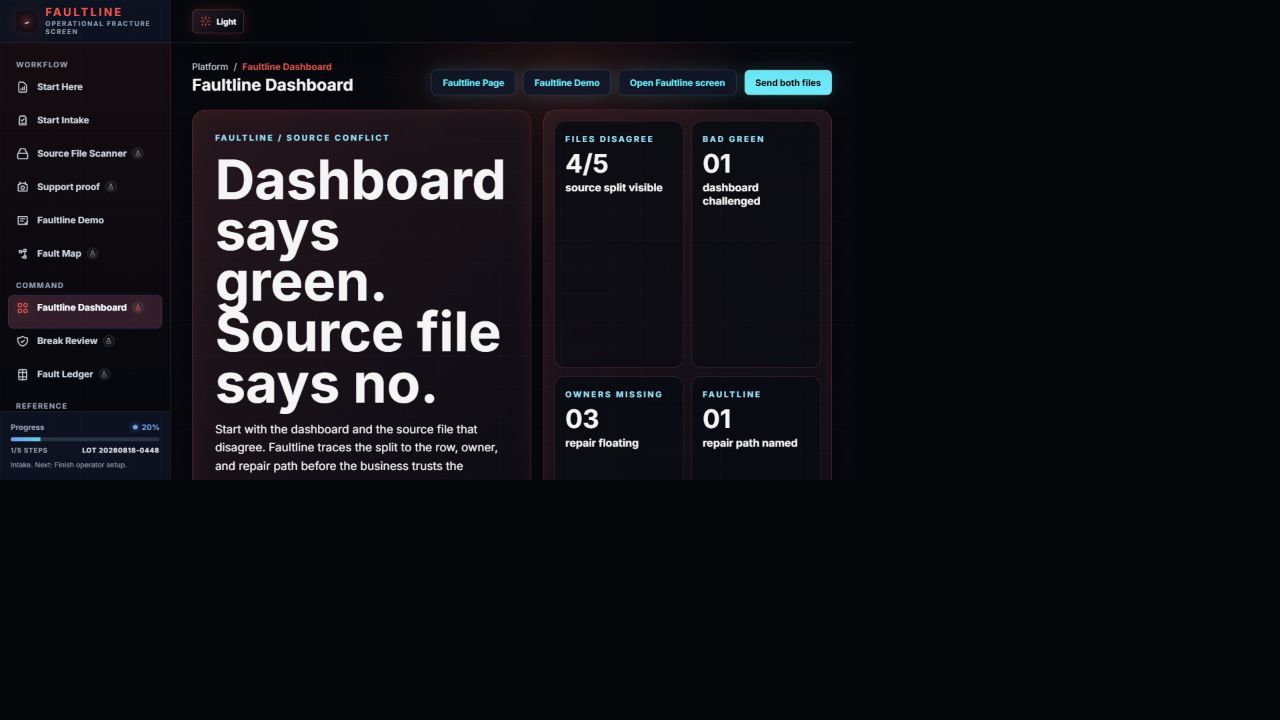
For dashboards that look green while the source file is already red.
Break visible. Owner named. Wrong answer stopped.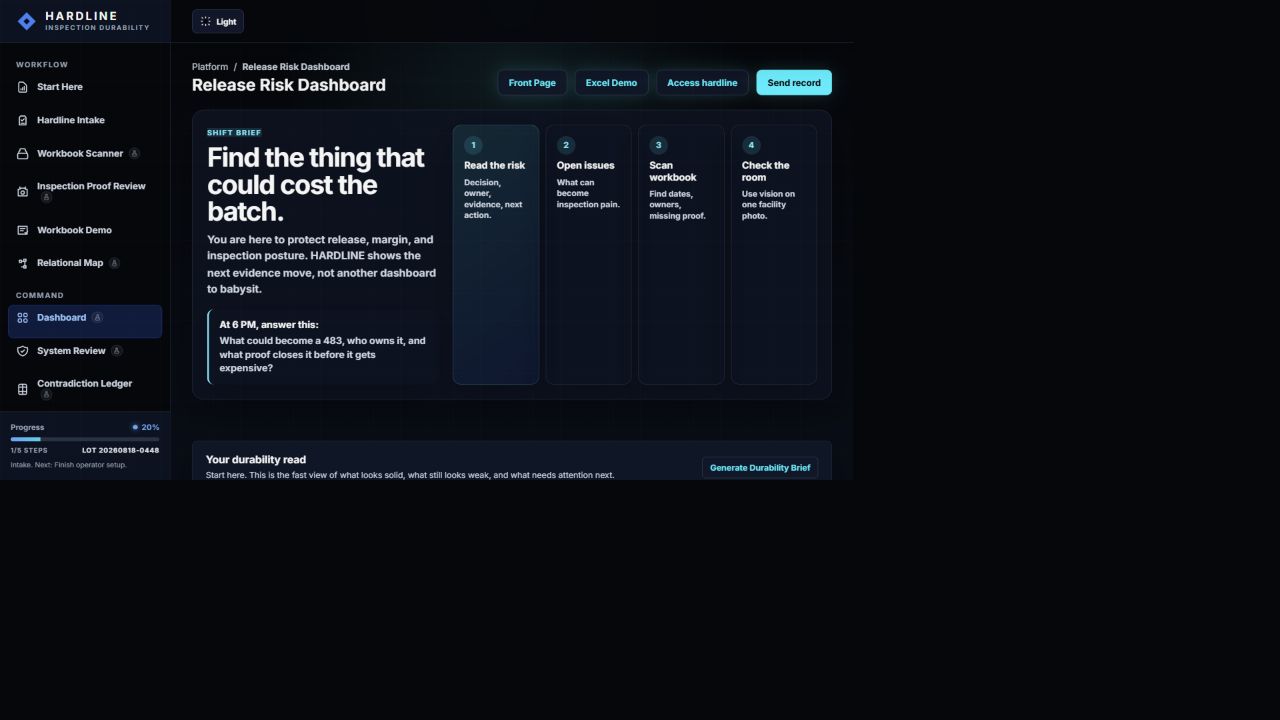
For records, evidence, and handoffs that need to survive review pressure.
Source checked. Repair holds. Next move clear.Start with the file that costs time. Compare it to the dashboard. Name the owner. Ship the repair view.
We'll review the file, tracker, report, or dashboard that needs manual work. Spectre maps it and shows the first move.
Start with the spreadsheet, report, or workflow that keeps breaking the day.